|
||
|
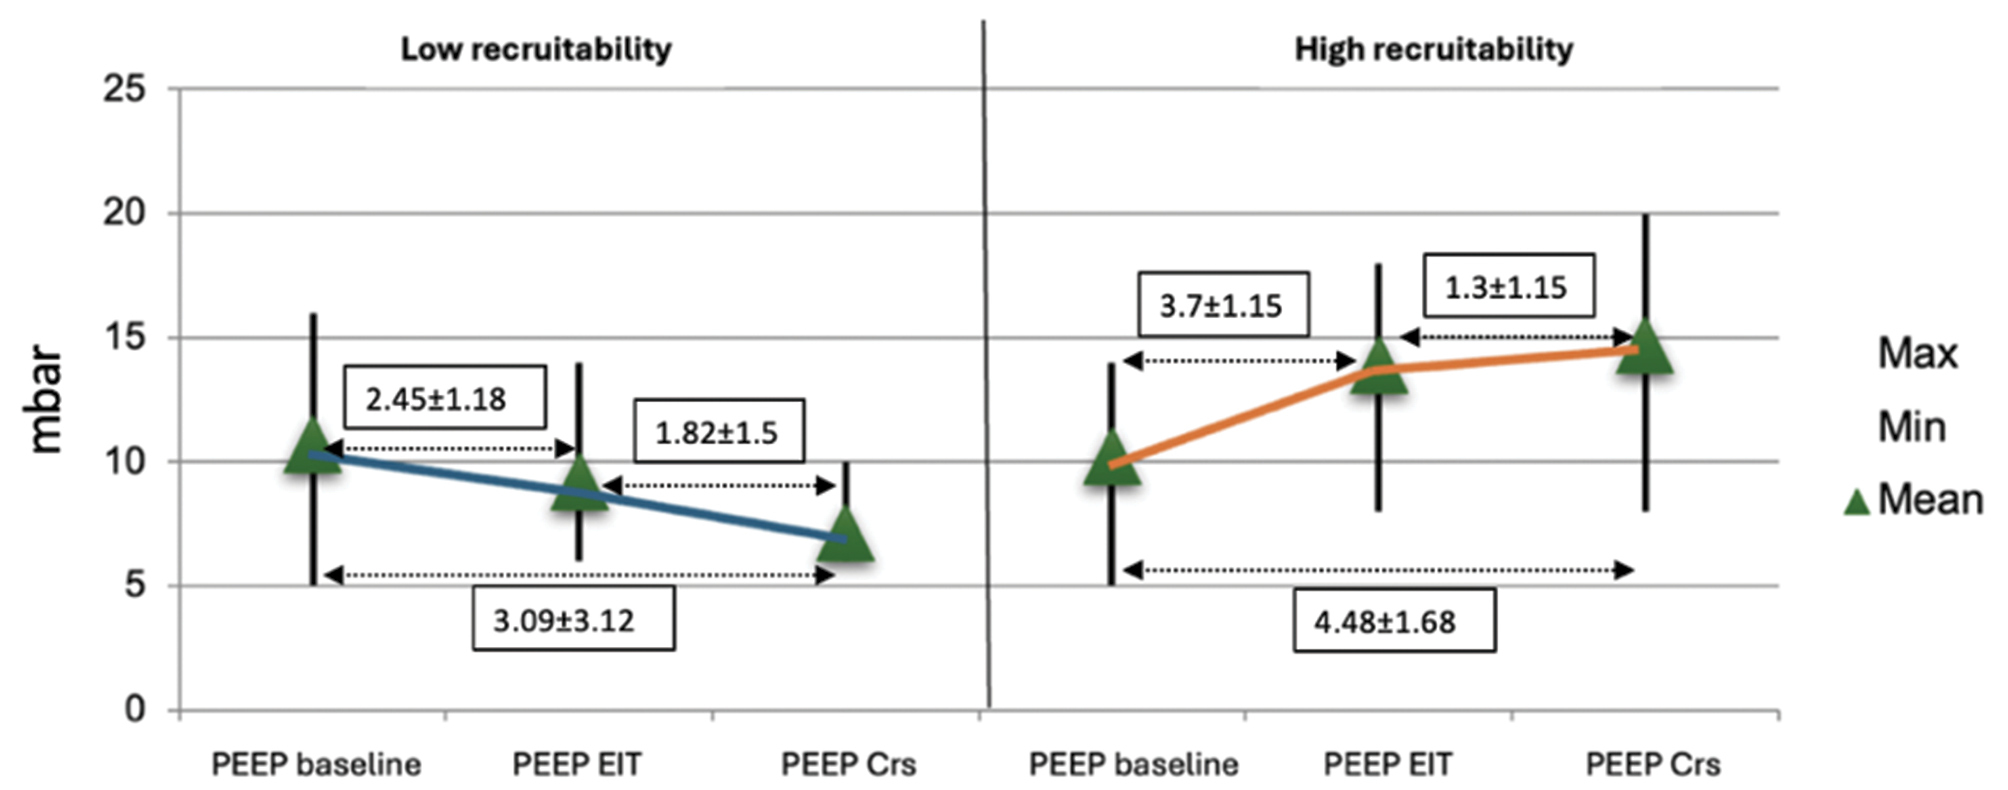
Comparison between baseline PEEP levels, PEEP at the crossing point and PEEP with highest Crs in the groups with low and high recruitability. Differences between each PEEP value with standard deviation are given in boxes. |
|
||||||||
| Part of: Kazakov D, Kyosebekirov E, Nikolova-Kamburova S, Stoilov V, Mitkovski E, Pavlov G, Stefanov C, Sandeva M (2024) PEEP titration guided by electrical impedance tomography in critically ill mechanically ventilated patients with acute hypoxemic respiratory failure. Folia Medica 66(6): 869-875. https://doi.org/10.3897/folmed.66.e134512 |