|
||
|
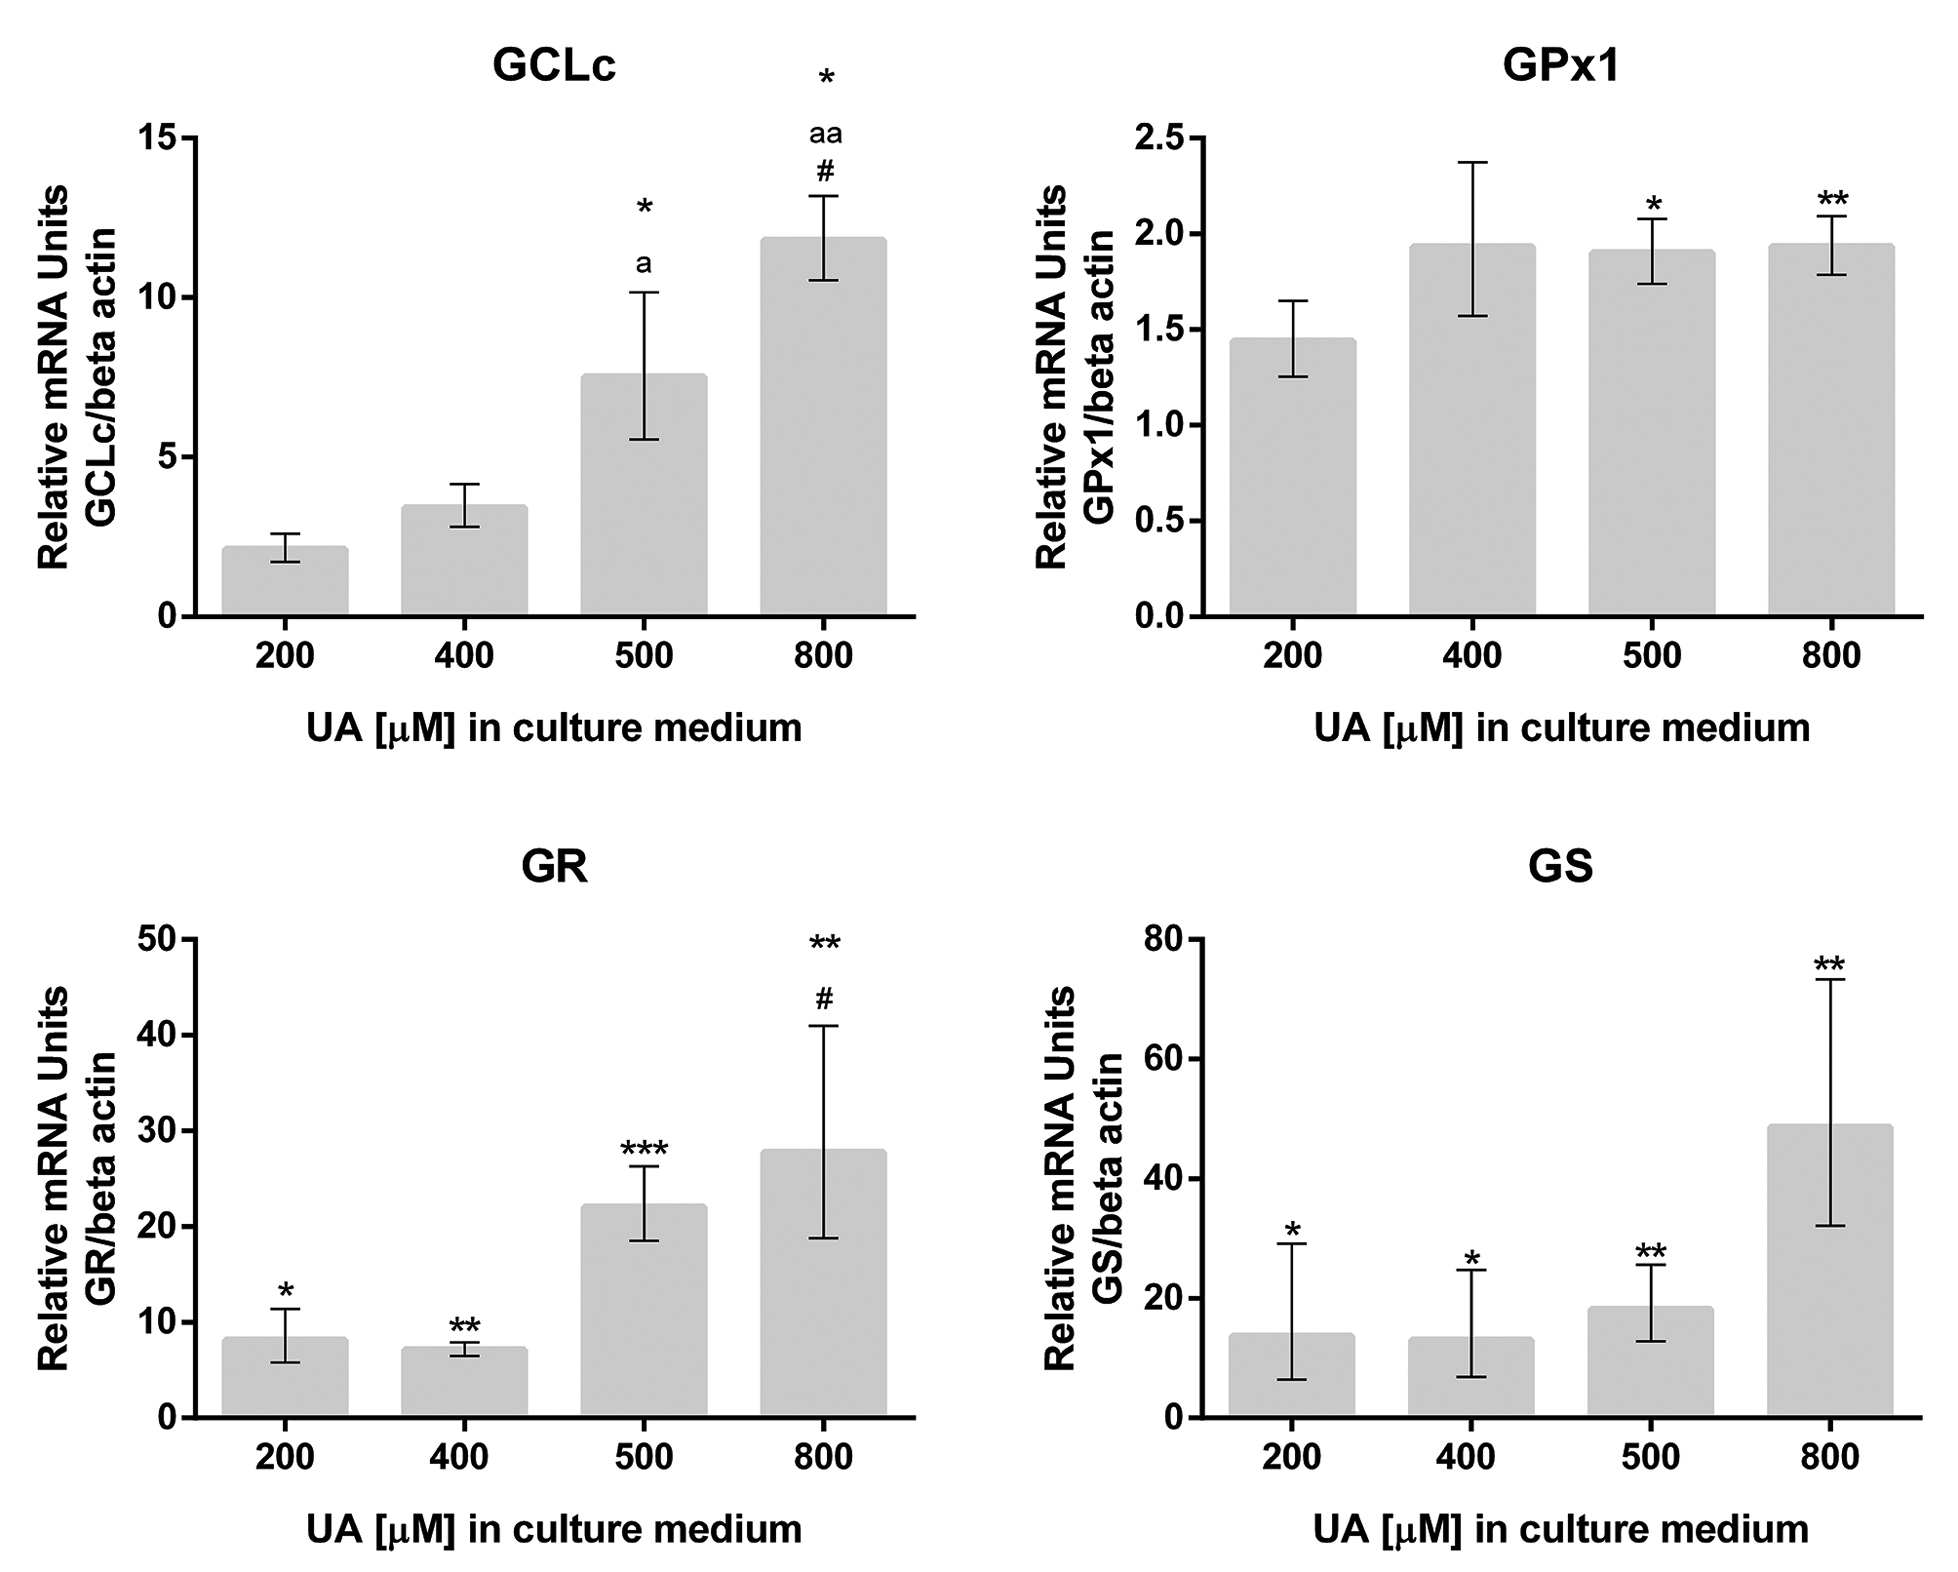
Relative mRNA units of studied genes. Gene expression is calculated with the delta-delta Ct method (2-∆∆Ct) where the value of mRNA in the control, non-treated group is considered to be equal to 1. * p<0.05 – p value vs. control; ** p<0.01 – p value vs. control, ***p<0.001 – p value vs. control; a – p<0.05– p value vs. 200 μM; aa – p<0.01 – p value vs. 200 μM; # -p<0.05 – p value vs. 400 μM. Results are presented as mean±SEM. |