|
||
|
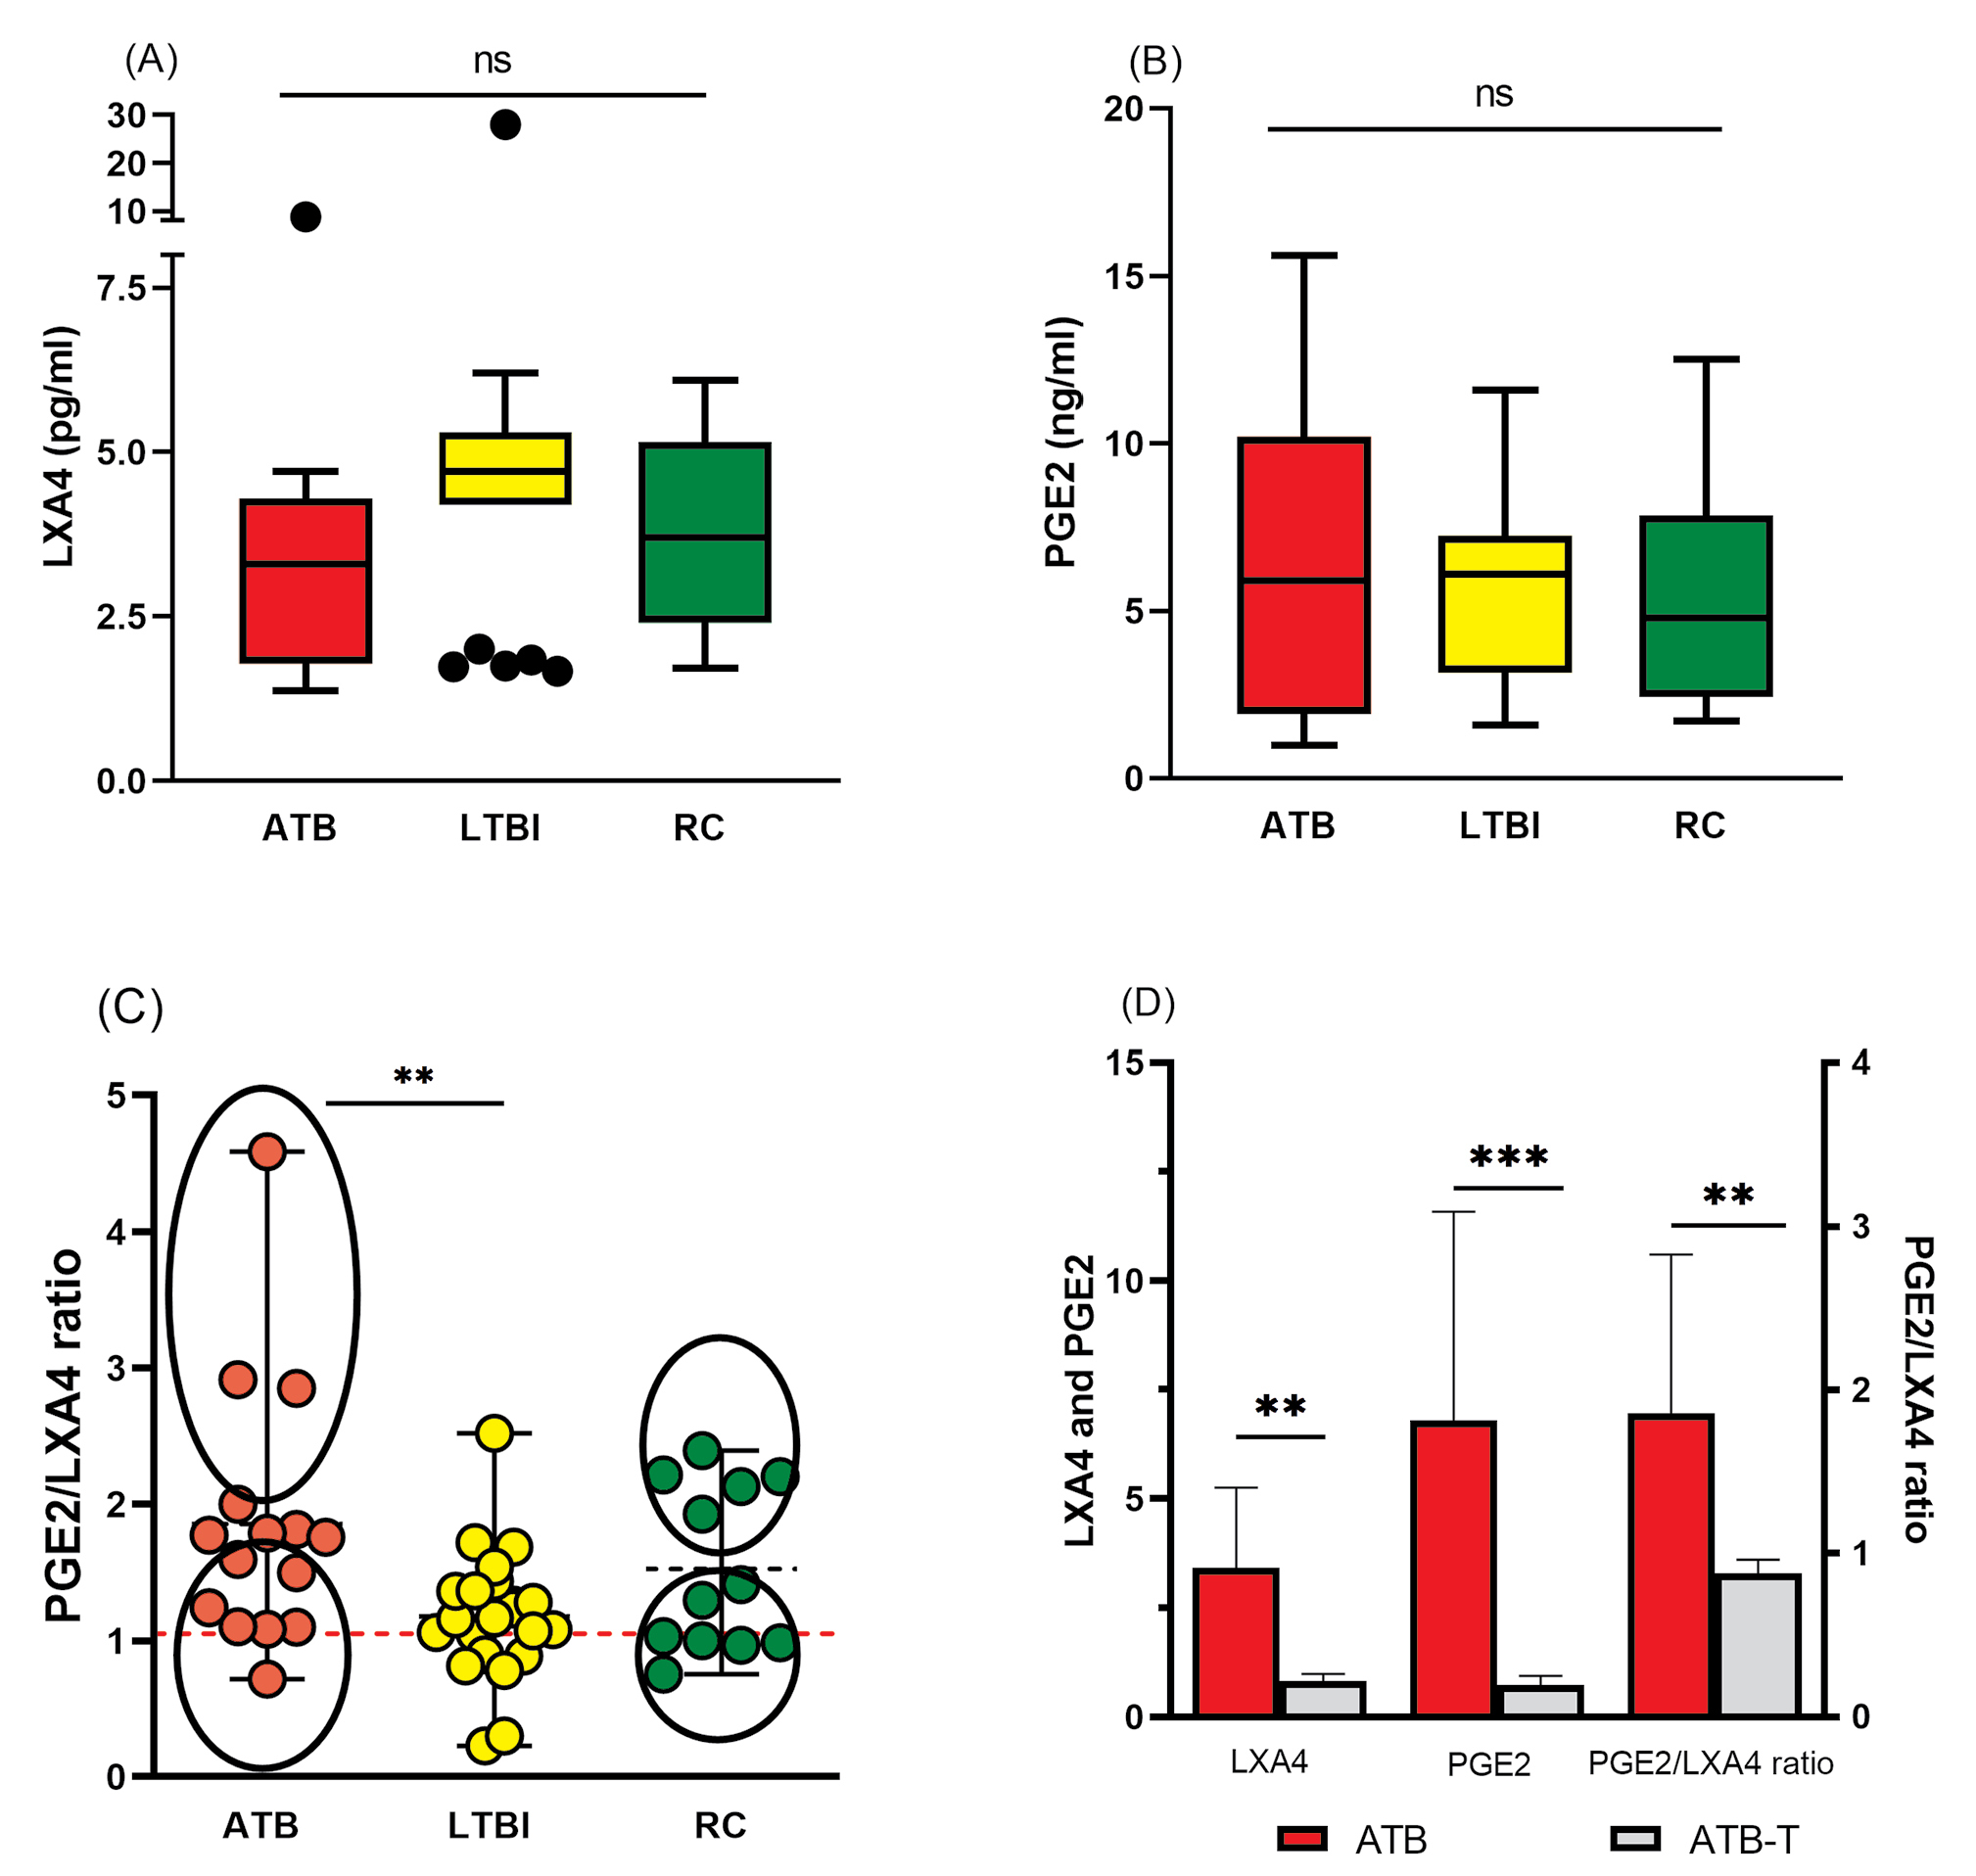
A-D. Stimulated expression of eicosanoids in ATB, LTB and RC groups. The PHA-stimulated concentrations of LXA4 (A), PGE2 (B) and PGE2/LXA4 (C) ratio were measured in ATB (n=15), LTBI (n=22) and RC (n=12) donors. The same parameters were compared between ATB and ATB-T (n=6) (D). Data is presented as Tukey plots (A, B), scatter plot (C) with each circle representing a single individual, and column bars (mean+SD). PGE2/LXA4high and PGE2/LXA4low subgroups among RC and ATB donors are encircled. The red dotted line corresponds to the ratio calculated for HC (n=15). P-values were calculated using ANOVA test (*** p<0.001, ** p<0.01, * p<0.05, ns = p>0.05). |